Robert Mundigl highlights that despite the popularity of Choropleth Maps, there are several significant disadvantages for presenting data with a geographical dimension with this type of visualization and tried to addressed them in a follow-up article.
After reading about all those issues, I am tempted to paraphrase Mark Twain’s popular quote as “Lies, damned lies & Choropleth maps !” In addition, Mark Monmonier demonstrates in his book “How to Lie with maps” that, despite their immense value, maps lie !
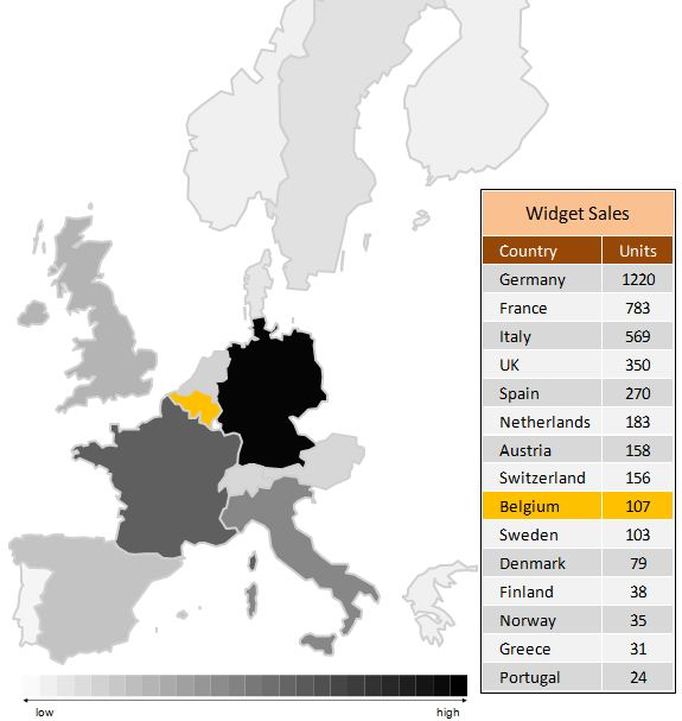
Despite the criticism, I believe that choropeth maps can spice-up dashboards or PowerPoint presentations under certain circumstances, if used creatively. I tried to partially address the lack of information on exact values and the associated perception issues by displaying a pop-up table alongside an interactive choropleth map in this introductory tutorial as inspired by a discussion in LinkedIn. Please note that for tutorial purposes, hyperlink screentips are not used in this example, so shapes in groups are allowed.
Since each country is a unique free-form shape or a group of shapes in Excel, by assigning a macro to the OnAction property of each country shape or group, the map can become interactive e.g. clicking a country displays the pop-up table (if not already shown) and a row with data for the selected country is highlighted along with the country on the map. If not required, the table can be hidden by clicking on it

The pop-up table has been created by the camera tool, which creates a mirror image of a range as a Shape object. In this way, the pop-up table is linked dynamically to a range. During interactive use e.g. by clicking on the map, the main change shown in the range and thus reflected in the table is the highlighted row in orange colour.
Tip: Please note the anchoring in the conditional format formula needed to highlight 2 columns / one row and the rule order (on top of the row banding rules).
Tip: Please note the anchoring in the conditional format formula needed to highlight 2 columns / one row and the rule order (on top of the row banding rules).
The pop-up table can be hidden, if clicked, by setting the Visible property of the shape to False. The choropleth map is also repainted to remove the orange highlight colour from the previously selected country.
Sub HideTableCamera()
Call UpdateMap
Sheets("Europe Map").Shapes("CameraTable").Visible = False
End Sub
The OnAction macro uses the Application.Caller property to identify the shape clicked. Sheets("Pivot").Range("ControlCell") = CountryID(Application.Caller)
The map is repainted to remove the orange highlight colour, if any.
Call UpdateMap
The pop-up table is displayed, if hidden.
Sheets("Europe Map").Shapes("CameraTable").Visible = True
Finally the country clicked is highlighted in orange colour.
Sheets("Europe Map").Shapes(strCountry).Fill.ForeColor.RGB = RGB(255, 192, 0)

Tip: The RGB values of any colour can be read by clicking Fill Colour (Home tab), then the "More (Fill) Colors" and finally by selecting the Custom tab.
The main procedure (UpdateMap) retrieves the value of each shape by using its name, looks-up the colour code and paints the shape. In order to keep the European map less cluttered, shapes with zero values are not shown by setting their Visible property to False.
For Each oRng In oDataWS.Range("rngCountries")
Set oShp = Sheets("Europe Map").Shapes(oRng.Value2)
oShp.Placement = xlFreeFloating 'precaution against map distortion, if rows or columns are resized
nValue = oDataWS.Cells(oRng.Row, oRng.Column + 2)
nColorCode = Application.WorksheetFunction.VLookup(nValue, oControlWS.Range("rngNormalized"), 2, True)
If nValue = 0 Then
oShp.Visible = False
Else
oShp.Visible = True
oShp.Fill.ForeColor.RGB = RGB(nColorCode, nColorCode, nColorCode)
End If
Next
| choroplethmapofeurope_proofofconcept.xlsm | |
| File Size: | 117 kb |
| File Type: | xlsm |


